SigmaPlot - The technical graphing software choice for more than 100,000
professional researchers.
SigmaPlot software helps you quickly create exact graphs
SigmaPlot graphing software from SPSS Science takes you beyond simple
spreadsheets to help you show off your work clearly and precisely. With
SigmaPlot, you can produce high-quality graphs without spending hours in
front of a computer. SigmaPlot offers seamless Microsoft Office integration,
so you can easily access data from Microsoft Excel spreadsheets and present
your results in Microsoft PowerPoint presentations.
Graphing software that makes data visualization easy
Graph creation starts with SigmaPlot's award-winning interface. Take
advantage of industry-standard menu design, menu toolbars, right mouse
button support and graph preferences. Select the graph type you want to
create from the Graph Toolbar's easy-to- read icons. The interactive Graph
Wizard leads you through every step of graph creation. You get compelling,
publication- quality charts and graphs in no time. SigmaPlot offers more
options for charting, modeling and graphing your technical data than any
other graphics software package. Compare and contrast trends in your data by
creating multiple axes per graph, multiple graphs per page and multiple
pages per worksheet. Accurately arrange multiple graphs on a page using
built-in templates or your own page layouts with SigmaPlot's WYSIWYG page
layout and zoom features.
More than 80 2-D and 3-D technical graph types
From simple 2-D scatter plots to compelling contour plots, SigmaPlot gives
you the exact technical graph type you need for your demanding research.
And, to help you see interactions in your 3-D data, SigmaPlot powerfully
renders multiple intersecting 3-D meshes with hidden line removal. With so
many different chart and graph types to choose from, you can always find the
best visual representation of your data.
Customize every detail of your charts and graphs
SigmaPlot offers the flexibility to customize every detail of your graph.
You can add axis breaks, standard or asymmetric error bars and symbols;
change colors, fonts, line thickness and more. Double-click on any graph
element to launch the Graph Properties dialog box. Modify your graph, chart
or diagram further by pasting an equation, symbol, map, picture,
illustration or other image into your presentation.
Quickly Plot your Data from Existing Graph Templates in the
Graph Style Gallery
Save all of the attributes of your favorite graph style in the new Graph
Style Gallery. Add greater speed and efficiency to your analysis by quickly
recalling an existing graph type you need and applying its style to your
current dataset.
Publish your charts and graphs anywhere
Create stunning slides, display your graphs in reports or further customize
your graphs in drawing packages. Save graphs for publication in a technical
journal, article or paper with SigmaPlot's wide range of graphic export
options. Presenting and publishing your results has never been easier - or
looked this good. Create customized reports with SigmaPlot's Report Editor
or embed your graphs in any OLE container - word processors, Microsoft
PowerPoint or graphics program. Just double click your graph to edit
directly inside your document. Quickly send your high-resolution graphs
online to share with others.
Share high-quality graphs and data on the Web
Export your graphs as high-resolution, dynamic Web pages - not simple GIF or
JPEG files. Viewers can explore data used to create graphs and zoom, pan or
print images at full resolution directly from a Web Browser. Automatically
generate active Web objects from your graphs or embed the objects within
other Web pages.
Share the data behind your graphs with colleagues and students
Enable colleagues to print your full report from your intranet or Web site
directly from their browsers - without compromising the quality of the
graphs Create an optional password while exporting your graph to limit data
access to authorized users Produce Web documents without knowing HTML, or
embed SigmaPlot Web object graphs in existing HTML files to create
interactive electronic reports
Data Analysis Doesn't Get Any Easier
SigmaPlot provides all the fundamental tools you need to analyze your data
from basic statistics to advanced mathematical calculations. Click a toolbar
button to instantly generate summary statistics including 95% and 99%
confidence intervals. Run t-tests, linear and non-linear regressions with
ease. You can fit a curve or plot a function and get a report of the results
in seconds. Use built-in transforms to massage your data and create a unique
chart, diagram or figure. With SigmaPlot - it's all so simple!
Get more statistical capabilities when you combine SPSS with SigmaPlot
Use SPSS with SigmaPlot for more powerful statistical analysis and better
data management options. As the leading statistical software package for the
desktop, SPSS offers extensive statistical capabilities for your research.
Simply launch the SigmaPlot Graph Wizard from a drop-down menu in SPSS to
create high-quality graphs for print and presentation. Click here to find
out more about using SPSS with SigmaPlot.
Use SigmaPlot within Microsoft Excel
Access SigmaPlot right from your active Microsoft Excel worksheet. Tedious
cut-and- paste data preparation steps are eliminated when you launch
SigmaPlot's Graph Wizard right from the Excel toolbar. Use Excel in-cell
formulas, pivot tables, macros and date or time formats without worry. Keep
your data and graphs in one convenient file.
Use the Regression Wizard to fit data easily and accurately
Fitting your data is easy with the SigmaPlot Regression Wizard. The
Regression Wizard automatically determines your initial parameters, writes a
statistical report, saves your equation to your SigmaPlot Notebook, and adds
your results to existing graphs or creates a new one! The Regression Wizard
accurately fits nearly any equation - piecewise continuous, multifunctional,
weighted, Boolean functions and more - up to 10 variables and 25 parameters.
You can even add your own powerful curve fits to the Regression Wizard.
Plot ANY mathematical function
Plotting user-defined and parameterized equations is only a mouseclick away
with the Function Plotter. Just type the function or select one from the
built-in library and specify the parameters and the range. It's that simple!
Create your own built-in functions and save them for future use. Plot
functions on new or existing graphs or plot multiple functions
simultaneously using different parameter values. Save plotted X and Y
results to the worksheet.
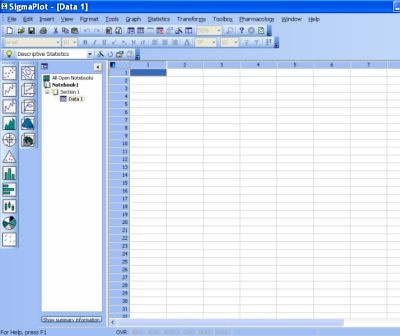
Manage your data efficiently
Manipulate over one billion data points in SigmaPlot's powerful scientific
data worksheet. Organize graph pages, SigmaPlot or Excel data worksheets,
curve fit results and reports effectively in the SigmaPlot Notebook. Run
simple mathematical transforms effortlessly with point-and-click using
SigmaPlot's quick transforms feature, or create powerful mathematical
routines to perform complex analyses with SigmaPlot's transform language.
Save time by writing a transform once, then save it for future use. Access
built-in transforms or create your own. Smooth your data optimally with
robust smoothing algorithms.
Automate complex repetitive tasks
Create macros in no time with SigmaPlot's easy-to-use macro language. Not a
programmer? No problem. With SigmaPlot, you can record macros by point-and
-click with the macro recorder. Use macros to acquire your data, execute
powerful analytical methods, and create industry- specific or field-specific
graphs. Use built-in macros as provided or use these macros as a base to
quickly create your own macros. Share the power of SigmaPlot with less
- experienced users by using macros to tailor the SigmaPlot interface for
your particular application. Create custom dialog boxes, menu choices and
forms to help guide novice users through a session.
Tap into SigmaPlot's powerful capabilities from other applications
Call on SigmaPlot's functionality from external sources that have Visual
Basic embedded including Microsoft Word and Microsoft Excel or custom
software applications. Analyze and graph your data using SigmaPlot within
those applications. For example, you can run a Visual Basic script in
Microsoft Word or Excel that calls on SigmaPlot to generate and embed your
graph in the document. SigmaPlot's OLE automation provides unlimited
Download File Size:25.86 MB