2014
Lynda
Gini Courter
5:57
English
Learn how you can easily search, access, and analyze data inside and outside of your organization in just a few clicks with Power BI—the business intelligence features that lie inside Microsoft Office. Author Gini Courter walks you through two toolsets: the self-service BI tools that only require Excel, and Power BI, which relies on Office 365. Using the Power Query, Power Pivot, Power Map, and Power View tools in Excel 2013, you'll learn to connect to local and remote data sources, model that data, and present your findings in the form of tables, charts, maps, and reports. Then Gini switches to Power BI to enhance and share the queries and reports you just created. As you'll soon find in the course of these tutorials, Microsoft's BI tools allow you to use the software you already know and love to analyze and share complex business data.
Introduction
Welcome
What you should know before watching this course
Using the exercise files
1. Getting Started: Self-Service, Power BI, and BI Tools
Understanding BI
What you need for Excel self-service BI
Understanding Office 365 Power BI
Enabling Component Object Model (COM) add-ins for Power Pivot and Power View
Installing Power Map
Installing Power Query
2. Using Power Query to Get Data
Searching for online data with Power Query
Types of Power Query data sources
Shaping data in the Query Editor
Transforming Data
Inserting custom columns
Appending queries
Duplicating a query
Merging queries
Connecting to an Excel data source
Connecting to a commercial data source
Troubleshooting queries
3. Modeling Your Data with Power Pivot
About Excel data models
Using Excel tables
Using Power Queries
Understanding relationships
Creating relationships between tables
Using database tables
Cleaning up the data model
4. Enhancing PivotTables and PivotCharts with Power Pivot
Creating a PivotTable
Marking a data table
Adding slicers to the PivotTable
Adding a timeline to a PivotTable
Creating and formatting a PivotChart
5. Expanding the Data Model in Power Pivot
Building the Contoso data model
Adding calculated columns
Understanding DAX functions in Power Pivot
Adding a related column
Building a hierarchy
Creating a measure
Creating a key performance indicator (KPI)
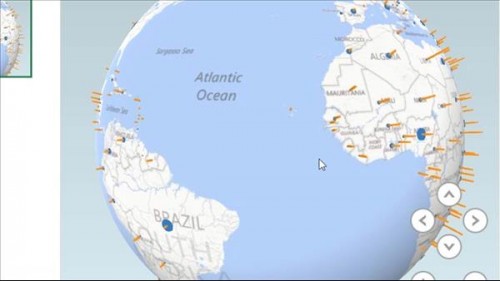
6. Visualizing Geospatial Data with Power Map
Understanding spatial data
Creating a tour
Using formatting tools
Using categories
Adding a scene to the tour
Adding detail with annotations and text boxes
Inserting a 2D chart
Visualizing data over time
Capturing a map screenshot
Saving a Power Map video
7. Creating and Formatting Power View Reports
Understanding Power View
Creating and using a table visualization
Saving a Power View report
Formatting a report
Refreshing Power View data
Changing a table to a matrix visualization
Adding data to a visualization
Applying filters
8. Creating Other Power View Visualizations
Creating a column chart
Creating bar, line, and pie charts
Creating chart multiples to display data details
Creating a scatter chart
Creating a map visualization
Adding slicers to reports
Creating a card visualization
Using tiles for navigation
9. Sharing Your Data Using Power BI for Office 365
What you need for Power BI
Sharing and using Power Queries
Sharing a Power View report
Using the Power BI sites
Getting started with Power BI Q&A
Adding synonyms to a data model
Improving the data model for QA
Conclusion
Next steps
Download File Size:1.24 GB