2016
Lynda
Gini Courter
2:55
English
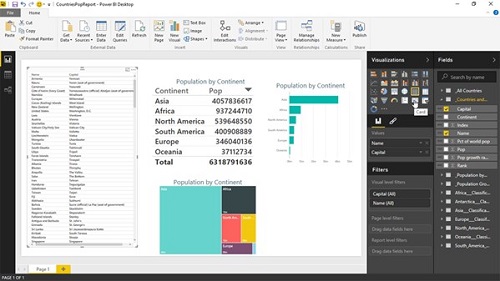
Get more insights from your data, whether it's stored on your computer or the cloud. Learn how to connect to and merge data with Microsoft Power BI Desktop, the powerful data analysis and visualization software. In this course, you'll learn how to connect various data sources, including Excel, Access, and web data sources (including Facebook), and search and transform the data with simple queries. Gini Courter also shows how to create relationships between data sources, merge data, and build and share reports.
Introduction
Welcome
What you need for this course
How to use the exercise files
1. Get Started
Understanding Power BI
What are Power BI Desktop and Desktop Pro?
Installing Power BI Desktop
Launching Power BI Desktop
2. Get Data
Understanding Power BI data sources
Connecting to a file: Excel
Connecting to a file: CSV
Connecting to a database: Access
Connecting to a web data source
Connecting to Facebook
Importing Excel data models
3. Model Data: Shaping, Combining, and Merging Data
Reducing data with the Query Editor
Transforming data
Inserting custom columns
Appending data to a query
Adding an index column
Cleaning up data
Creating relationships between tables
Merging data
Using lookup tables in a dataset
4. Create Visualizations and Reports
Creating and arranging visualizations
Creating text visuals: Cards, table, matrix
Creating and formatting chart visuals
Using a slicer to filter visuals
Creating a map visualization
5. Share Your Work
Publishing to the Power BI service
Republishing a dataset to the Power BI service
Refreshing and removing datasets and reports
Sharing and unsharing reports
Conclusion
Next steps
lynda.com/Power-BI-tutorials/Up-Running-Microsoft-Power-BI-Desktop/445425-2.html
Download File Size:547.53 MB