2015
Lynda
Bill Shander
3:38
English
Making "big picture" data relevant for a general audience is a challenging yet common design job. Data visualizations are great solutions; they can illustrate important global issues and bring some of the interesting stories in the data to light.
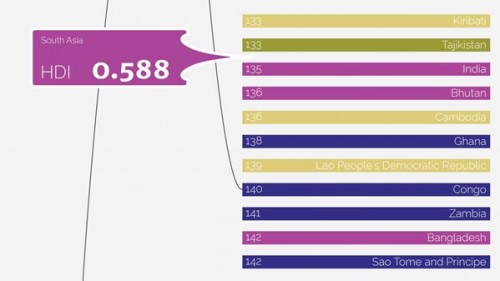
The UN Human Development Index used in this course is a perfect example: a composite number used to rank countries on how well they're doing across a range of measures (such as health, wealth, and education). Instructor Bill Shander shows how to make this index data tangible and approachable by imagining the story and visual approach first. He then builds the design in Adobe Illustrator, capitalizing on some automation and scripting abilities the program offers. Start watching for unique insights into the entire data visualization process.
Introduction
Welcome
What you should know before watching this course
Using the exercise files
1. Getting to the Idea
The big idea
Understanding the data
Working with the data: getting started
Working with the data: ranking countries by the components
Working with the data: calculating the rank variances
Working with the data: trends data
Working with the data: inequality data
Developing the story
2. Getting to the Visual Approach
Sketching and wireframing
3. Roughing Out the Design Elements
Setting up the design file
Roughing out the country list
Roughing out the trends sparklines
Roughing out the inequality bars
Roughing out the Human Development Index (HDI) and its components
4. Bringing the Visuals to Life
Adding country names and ranks
Adding sparklines (manually)
Adding sparklines (scripting)
Adding inequality (manually)
Adding inequality (scripting)
Adding HDI and its components (manually)
Adding HDI and its components (scripting)
Adding regional callout boxes
Adding story callout boxes
Adding text, legends, labels, and sources
Conclusion
Next steps
Download File Size:707.1 MB